Candlestick patterns help forecast future price movements. Explore 16 of the most prevalent candlestick patterns and learn how to utilize them to spot potential trading opportunities.
What is a candlestick?
A candlestick is a type of chart used in technical analysis to represent the price movement of an asset over a specific period. Each candlestick provides four key pieces of information for that time frame:
- Open Price: The price at which the asset first traded upon the opening of the period.
- Close Price: The price at which the asset last traded at the close of the period.
- High Price: The highest price reached during the period.
- Low Price: The lowest price reached during the period.
The candlestick is composed of a “body” and “wicks” (or “shadows”). The body represents the range between the open and close prices, while the wicks show the high and low prices. If the close price is higher than the open price, the body is typically filled with a lighter color (often white or green), indicating a bullish trend. If the close price is lower than the open price, the body is filled with a darker color (often black or red), indicating a bearish trend.

Six bullish candlestick patterns
Bullish patterns often emerge after a market downtrend, indicating a potential reversal in price movement. These patterns can serve as indicators for traders to consider opening long positions in anticipation of an upward trajectory and potential profits.
-
Hammer
A hammer candlestick is characterized by a small body, a long lower wick, and minimal to no upper wick. It often appears as a sign of exhaustion during a downtrend and suggests a potential bullish reversal.
In a hammer pattern, sellers drive the price to new lows within the session but fail to sustain it. Buyers step in, pushing the price back up, so the market closes near its opening price or higher. If the hammer is red (bearish), it indicates the market closed slightly lower than it opened. Conversely, if the hammer is green (bullish), closing above the opening price, the reversal signal is considered stronger.
For a candlestick to be recognized as a hammer, the lower wick should be at least twice or three times the length of the body.

-
Inverse Hammer
An inverse hammer is essentially the opposite of a regular hammer. It features a small body, but with a long upper wick and minimal to no lower wick.
In this pattern, buyers (bulls) initially push the price higher during a downtrend, gaining control early in the session. However, the reversal does not sustain, and sellers (bears) step in to bring the price back down, closing it near the opening price. Despite this, the bears are unable to maintain the downturn, which could signal a potential shift in momentum towards the upside.

-
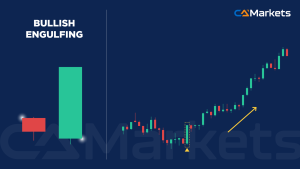
Bullish Engulfing
A bullish engulfing candlestick pattern consists of two distinct candles. The first is a red bearish candle that appears during a downtrend.
This bearish candle is followed immediately by a green bullish candle that fully engulfs the previous one. This pattern suggests that buyers entered forcefully, pushing the price up from where it closed on the previous candle, ultimately closing above the previous candle’s high.
At the end of this pattern, the market should close at or near the top of the period, with minimal to no noticeable upper or lower wick on the bullish candle. This indicates strong buying momentum and a potential reversal in the downtrend.
-
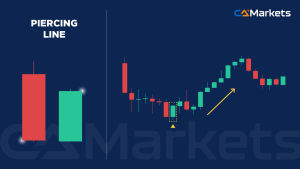
Piercing Line
A piercing line pattern is similar to a bullish engulfing pattern but has distinct characteristics and indicates a potential market reversal. It consists of two candlesticks: a red bearish candle followed by a green bullish candle.
In a piercing line pattern, the bearish candle has a longer body and is not fully engulfed by the bullish candle. Typically, there is a gap between the close of the bearish candle and the open of the bullish candle, with the bullish candle closing above the midpoint of the bearish candle.
This pattern signals a market reversal, where bears controlled the market initially, but by the middle of the second session, bulls took over and drove the price higher.
-
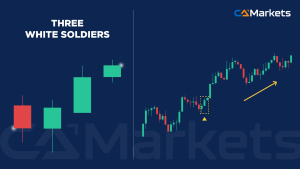
Three White Soldiers
After a pronounced downtrend, the three white soldiers pattern signals a strong reversal. This pattern consists of three consecutive green or white bullish candles.
For the pattern to be valid:
- The first bullish candle should close within the range of the preceding red bearish candle.
- The second bullish candle should close above the open of the bearish candle.
- The third bullish candle should close higher than the close of the second bullish candle.
Each of the three candles should display progressively longer bodies, reflecting increasing buying momentum. This pattern strongly suggests that the downtrend is reversing into an uptrend.
-
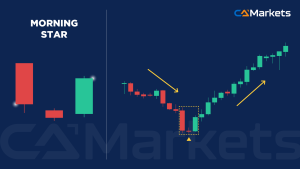
Morning Star
The morning star pattern is a significant signal that a reversal from a downtrend may be imminent. This candlestick pattern consists of three distinct candles:
- First Candle: A long red candle that represents the continuation of the downtrend.
- Second Candle: A small-bodied doji or spinning top candle. The second candle’s color (bullish or bearish) is less important than its size, which should be small. This candle often appears with gaps from the first and third candles.
- Third Candle: A long green bullish candle that follows the doji or spinning top.
The morning star pattern suggests that, although sellers initially dominated, they were unable to maintain the downtrend. The emergence of the long bullish candle indicates that buyers are starting to take control, indicating a potential shift towards an uptrend.
Six Bearish Candlestick Patterns
Now that we’ve covered the six most common bullish candlestick patterns, let’s explore the six bearish candlestick patterns. These patterns can signal a potential reversal when the market is in an uptrend.
-
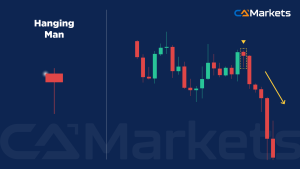
Hanging Man
A hanging man pattern resembles a hammer but appears after an uptrend. Like the hammer, it signals a potential reversal, this time indicating a shift from an uptrend to a possible downtrend.
In this pattern, sellers push the asset’s price lower during the session, but buyers step in and drive the price back up. Despite this rebound, the buyers fail to sustain the upward momentum, suggesting that control may shift to the sellers and a downturn could be on the horizon.
-
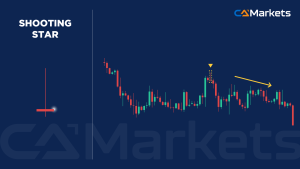
Shooting Star
The shooting star pattern is a key indicator of a potential market reversal, and it mirrors the hanging man pattern but in reverse. Instead of having a small body with a long lower wick, the shooting star has a small body at the bottom with a long upper wick.
Similar to the inverse hammer pattern discussed earlier, the shooting star reflects a scenario where sellers push back against an initial upward movement. This pattern appears at the peak of an uptrend, suggesting that the momentum may shift and a reversal to a downtrend could be imminent.
-
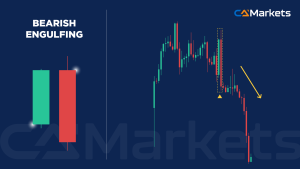
Bearish Engulfing
A bearish engulfing pattern is the opposite of a bullish engulfing pattern. In this setup, the second red bearish candle completely engulfs the first green bullish candle.
The first bullish candle closes, and in the next session, the market opens higher but quickly drops as sellers gain control. The second candle’s body should be larger and encompass the entire range of the first candle.
As selling pressure increases, supply outweighs demand, signaling a potential shift towards a downtrend. The second candle typically has little to no wicks on either end, similar to the bullish engulfing pattern.
-
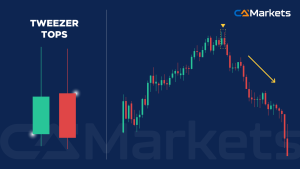
Tweezer Tops
The tweezer tops pattern consists of two consecutive candles and serves as a bearish reversal signal. The first candle is a green bullish candle, while the second is a red bearish candle. Both candles feature short bodies with long upper wicks.
In a tweezer tops pattern, the upper wicks of both candles should be at the same level, creating a symmetrical appearance. This pattern suggests that buyers attempted to push the market to new highs twice but failed, as the market then retreats to the opening level of the first candle by the close of the second candle.
The alignment of the wicks and the failure to sustain higher prices signal a potential shift in momentum, indicating that a downtrend could be on the horizon.
-
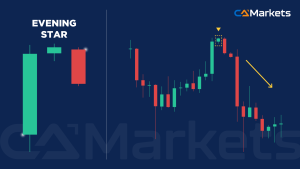
Evening Star
The evening star pattern is similar to the morning star pattern but signals a potential bearish reversal. It consists of three candles:
- First Candle: A long green bullish candle that indicates a continued uptrend.
- Second Candle: A small doji or spinning top candle, which represents market indecision. The color of this candle is less significant than its small size. This candle should gap away from the first and third candles on both the open and close.
- Third Candle: A long red bearish candle that confirms the reversal.
In the evening star pattern, the first candle shows strong buying momentum, which stalls as the second candle forms, indicating indecision or a pause. By the third candle, the market typically begins to retrace as sellers take control, leading to a potential downtrend as more traders close long positions and initiate short positions.
-
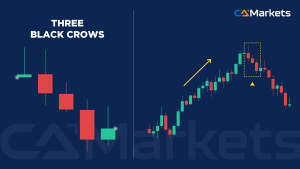
Three black crows
The three black crows pattern is akin to the three white soldiers but indicates a bearish reversal. Instead of three consecutive bullish candles, it features three consecutive bearish candles, signaling a strong potential shift to the downside.
For the pattern to be valid:
- First Candle: A bearish candle that closes within the range of the preceding green bullish candle.
- Second Candle: A bearish candle that closes below the open of the previous bullish candle.
- Third Candle: A bearish candle that closes below the close of the second bearish candle.
Each of the three bearish candles should have progressively longer bodies, reflecting increasing selling momentum. This pattern suggests a strong indication that a market reversal to the downside may be imminent.
Four Continuation Candlestick Patterns
The following candlestick patterns are known as continuation patterns. Unlike reversal patterns, these do not signal a change in market direction but can help traders identify periods of consolidation or indecision.
During these phases, the market might appear indecisive, suggesting that it could continue in its current trend. However, it’s important to remember that markets can be unpredictable, especially during periods of high volatility.
Here are four of the most common continuation patterns:
-
Doji
The doji is easily recognizable by its cross-like appearance, featuring a small or nearly non-existent body. The wicks on either side of the body can vary in length but should also be relatively short.
The key characteristic of the doji is its minimal body, indicating a balance between buyers and sellers, with neither side gaining control. The opening and closing prices are nearly the same, reflecting market indecision.
While a single doji signifies uncertainty, it can contribute to a reversal pattern when combined with other candlesticks, as seen in formations like the evening star and morning star.

-
Spinning tops
The spinning tops pattern consists of two candlesticks with small bodies and wicks of similar length. This pattern illustrates a struggle between buyers and sellers, with neither side gaining dominance, as the price closes close to its opening level.
Typically appearing after a significant uptrend or downtrend, the spinning top signals a period of market consolidation. It can suggest that the current trend might continue as the market takes a breather. Alternatively, if it occurs at the peak of an uptrend or the trough of a downtrend, it could indicate a potential reversal.
The pattern reflects a balance of power between buyers and sellers, signaling that one side may be losing control and suggesting a possible shift in market direction.

-
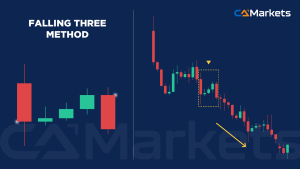
Falling three methods
This candlestick pattern, known as the Three Inside Down or Three Outside Down, consists of five candles and suggests that the current market trend may continue.
Here’s how it unfolds:
- First Candle: A long red bearish candle, indicating a continuation of the downtrend.
- Second to Fourth Candles: Three smaller green bullish candles that form within the range of the initial bearish candle.
- Fifth Candle: A long red bearish candle that closes below the low of the first bearish candle.
The pattern shows that buyers attempted to push the price higher but lacked the strength to sustain the move. Sellers reassert control, driving the price lower once more and reinforcing the existing downtrend.
-
Rising Three Methods
The rising three-method candlestick pattern, similar to the falling three-method pattern, occurs during an uptrend and consists of five candles arranged sequentially.
Here’s the breakdown:
- First Candle: A long green bullish candle, indicating the continuation of the uptrend.
- Second to Fourth Candles: Three smaller red bearish candles, which form within the range of the initial bullish candle.
- Fifth Candle: Another long green bullish candle that closes above the high of the first bullish candle.
This pattern shows that although sellers briefly attempt to push the price lower, they lack the strength to sustain the move. Buyers then drive the price back up, reinforcing the uptrend.

Are candlestick patterns reliable in trading?
Traders use candlestick patterns to guide their buying and selling decisions, as well as to determine when to take profits or cut losses. While no analysis or pattern is foolproof, many traders find candlestick patterns to be a valuable tool.
To maximize their effectiveness, traders should follow established criteria and wait for confirmation before making a trade. It’s often advisable to wait until a candlestick closes to make a decision.
Candlestick patterns aim to provide insights into potential market movements, helping traders anticipate trends and manage the risk of missing opportunities or experiencing adverse trades.
Candlestick patterns on higher time frames, such as daily or four-hour charts, tend to be more reliable than those on shorter time frames, like 15-minute or five-minute charts.
For best results, practice reading candlestick patterns using a demo account and consider other factors that align with your trading style and objectives.