In the dynamic world of forex trading, predicting price movements and making informed trading decisions are crucial for success. One of the most widely used methods for achieving this is technical analysis. But what exactly is technical analysis, and how does it apply to the forex market? Let’s dive into the fundamentals of technical analysis and explore its role in forex trading.
Understanding Technical Analysis
Technical analysis is a method of forecasting future price movements based on historical price data and market trends. Unlike fundamental analysis, which focuses on economic indicators, news, and financial statements, technical analysis relies on chart patterns, technical indicators, and historical price data to make trading decisions. By analyzing past price action, traders aim to identify patterns and trends that can suggest future market behavior.
Core Concepts in Technical Analysis
Price Charts
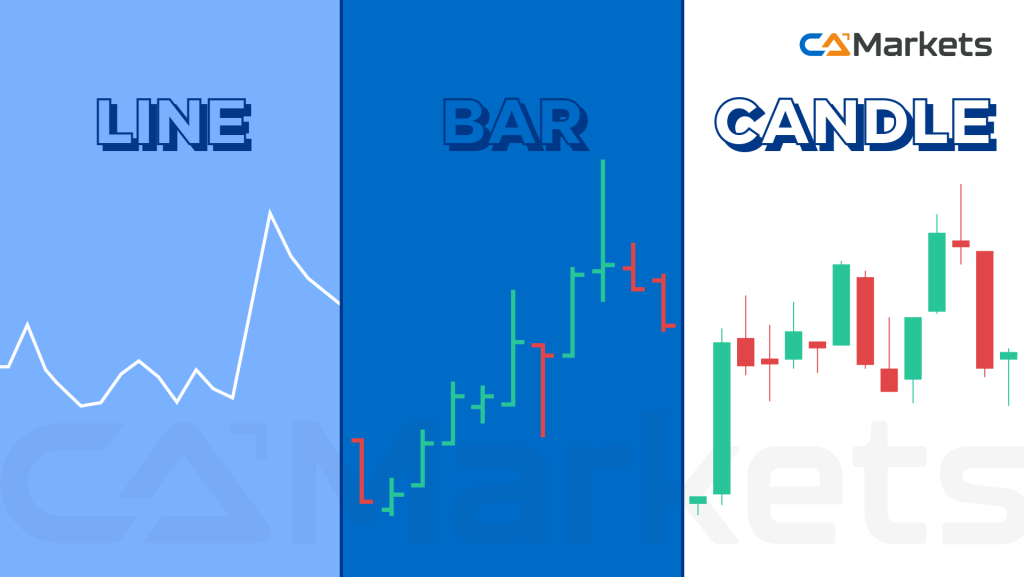
- Line Charts: Display closing prices over a set period, providing a simple view of price movement.
- Bar Charts: Show open, high, low, and close prices for a specific time frame, giving a more detailed view of price action.
- Candlestick Charts: Offer a visual representation of price movements with each candlestick representing a specific period, highlighting open, high, low, and close prices. Patterns such as Doji, Hammer, and Engulfing can signal potential market reversals.
Trend Analysis
Identifying Trends: Technical analysis helps traders identify trends—upward (bullish), downward (bearish), or sideways (range-bound). Recognizing the direction of the trend is crucial for making informed trading decisions.
Trend Lines: Used to visually represent the direction and strength of a trend by connecting significant highs or lows.
Support and Resistance Levels
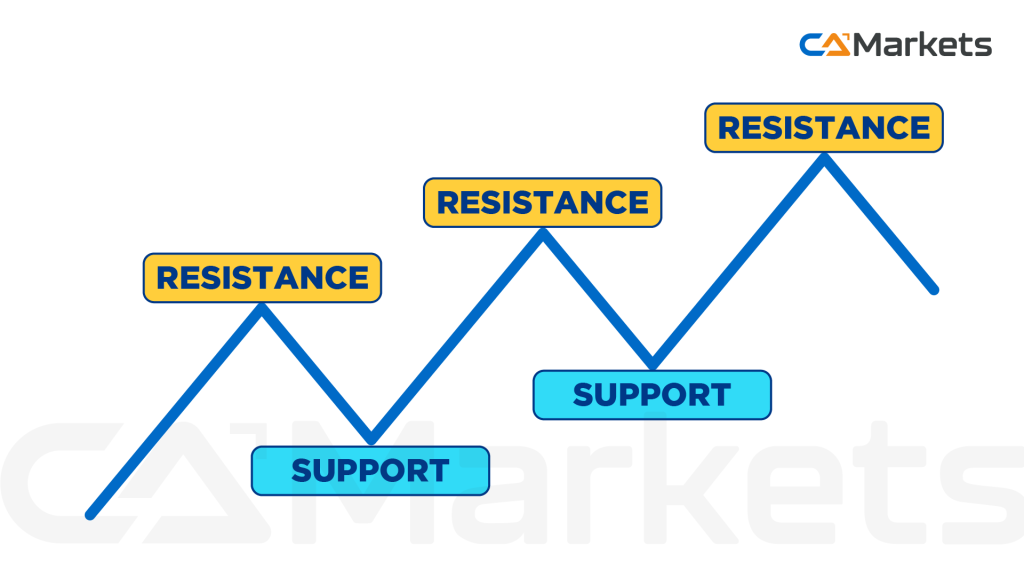
- Support: A price level where downward movement is expected to pause due to increased buying interest.
- Resistance: A price level where upward movement is likely to stall due to increased selling interest. Identifying these levels helps traders determine potential entry and exit points.
Popular Technical Indicators
- Moving Averages (MA): Simple Moving Average (SMA) and Exponential Moving Average (EMA) are used to smooth out price data and identify trends. Moving averages help traders spot trend direction and potential reversal points.
- Relative Strength Index (RSI): An oscillator that measures the speed and change of price movements, ranging from 0 to 100. RSI helps identify overbought or oversold conditions in the market.
- Moving Average Convergence Divergence (MACD): A trend-following momentum indicator showing the relationship between two moving averages. It helps identify changes in trend strength, direction, momentum, and duration.
- Bollinger Bands®: Consist of a middle band (SMA) and two outer bands representing standard deviations. Bollinger Bands® help measure market volatility and identify potential reversal points.
- Fibonacci Retracement Levels: Used to identify potential support and resistance levels based on the Fibonacci sequence, helping predict potential reversal points.
Chart Patterns
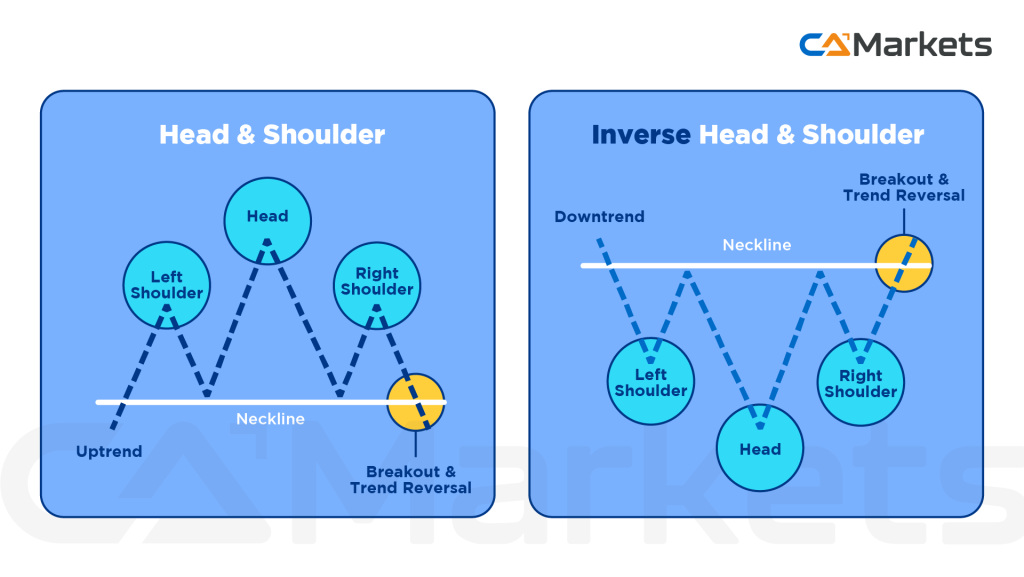
- Head and Shoulders: Indicates potential market reversals. The pattern can be bearish (Head and Shoulders) or bullish (Inverse Head and Shoulders), signaling trend changes.
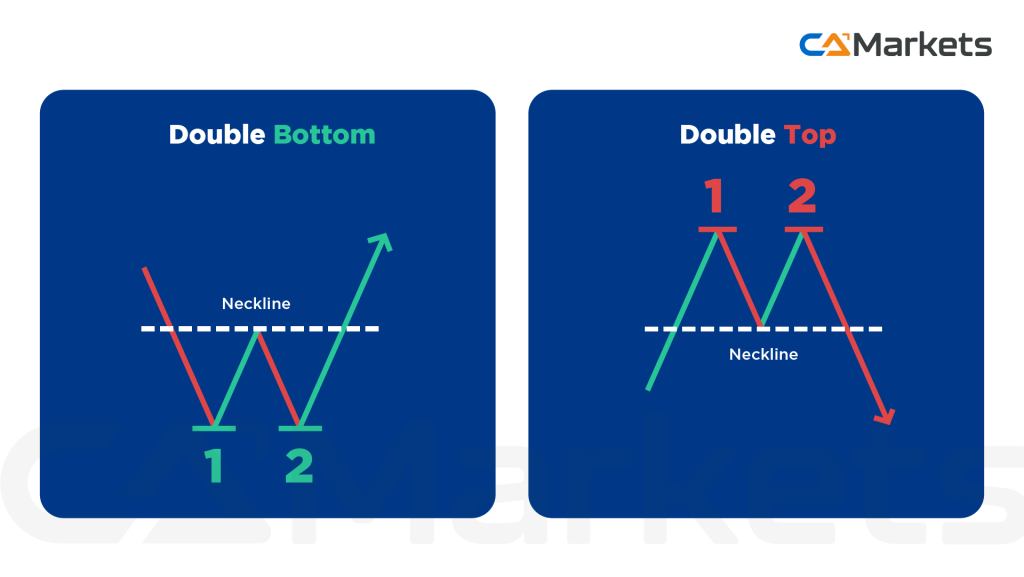
- Double Top and Double Bottom: These patterns suggest market reversals. A Double Top indicates a bearish reversal after an uptrend, while a Double Bottom signals a bullish reversal after a downtrend.
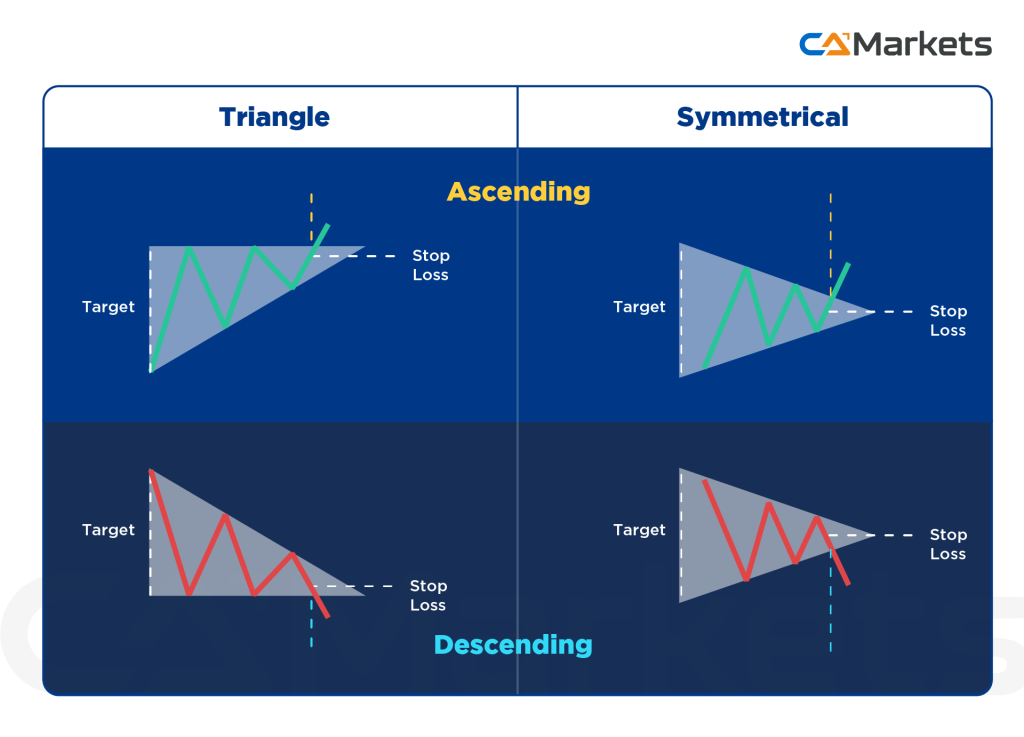
- Triangles: Triangular patterns, such as ascending, descending, and symmetrical triangles, indicate consolidation and potential breakout directions.
Applying Technical Analysis in Forex Trading
Technical analysis is particularly well-suited for the forex market due to its high liquidity and tendency to trend over time. Traders use technical analysis to develop trading strategies, set entry and exit points, and manage risk. By combining various indicators and chart patterns, traders can gain insights into market conditions and make more informed trading decisions.
Limitations and Considerations
While technical analysis is a powerful tool, it has limitations. Many technical indicators are based on historical data and can lag behind current market conditions. Additionally, technical analysis works best in trending markets and may be less reliable during periods of low volatility or market consolidation.
To maximize the effectiveness of technical analysis, traders often use it in conjunction with fundamental analysis and sentiment analysis. By considering a range of factors, traders can develop a more comprehensive understanding of the forex market and improve their trading strategies.
In summary, technical analysis is a vital tool in forex trading that helps traders forecast future price movements based on historical data and market trends. By understanding and applying various technical indicators and chart patterns, traders can enhance their decision-making process and increase their chances of success in the forex market.